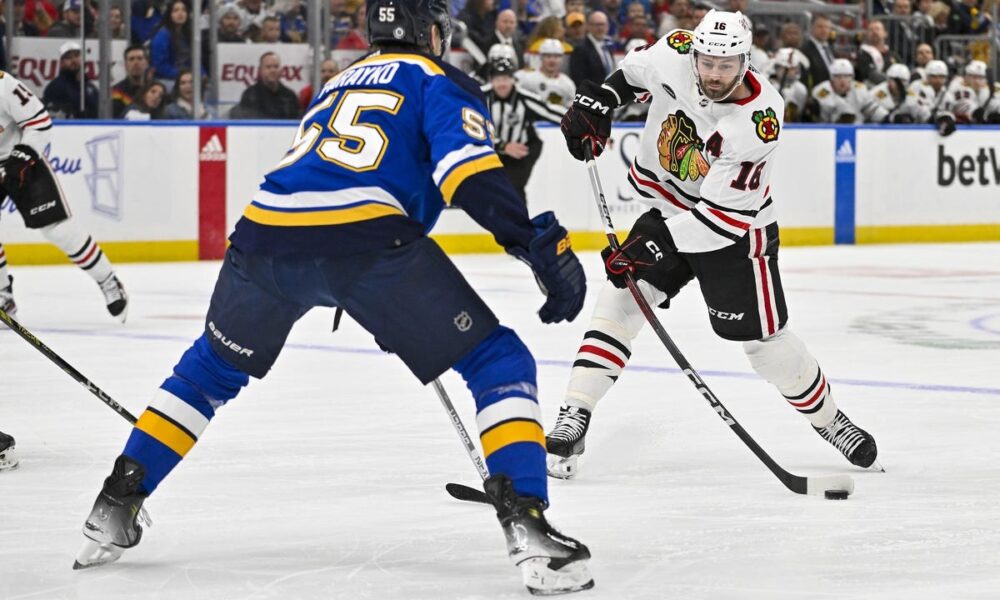
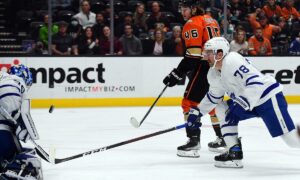
Kraken vs Wild Prediction, Pick, Preview & Betting Odds for 4/18/24
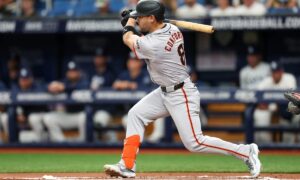
Diamondbacks vs Giants Prediction, Pick, Preview & Betting Odds – MLB 4/18/24
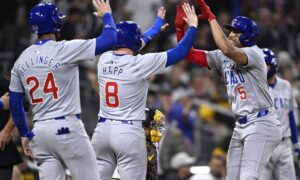
Marlins vs Cubs Prediction, Pick, Preview & Betting Odds – MLB 4/18/24
The National Hockey League playoffs are here, and there is reason to believe that this year’s festivities will be as exciting as...
In this NHL regular season prediction between the Ducks and Golden Knights, see who...
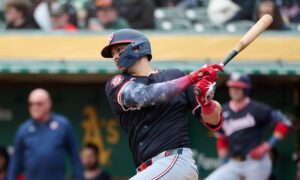
Check out our free Guardians vs Red Sox pick and preview for this MLB...
Check out our free Rangers vs Tigers pick and preview for this MLB matchup...
Nick Kelland of Basketball Forever joins the show to talk about how the Forever Network got it's start, plus where they are...
Check out our free Mariners vs Rockies pick and preview for this MLB matchup at Coors Field. See who we like to...
Check out our free Maple Leafs vs Bruins prediction for this NHL matchup in Boston. See who we like to win and...
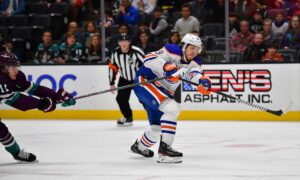
Read our Islanders vs Hurricanes prediction for this NHL regular season game in Raleigh. Check out who we like to win and...
Check out our free Rangers vs Braves pick and preview for this MLB matchup at Truist Park. See who we like to...
Check out our free Orioles vs Royals pick and preview for this MLB matchup at Kauffman Stadium. See who we like to...
Check out our free Angels vs Reds pick and preview for this MLB matchup at Great American Ball Park. See who we...
Check out our free Athletics vs Guardians pick and preview for this MLB matchup at Progressive Field. See who we like to...
Check out our free White Sox vs Phillies pick and preview for this MLB matchup at Citizens Bank Park. See who we...
Check out our free Astros vs Nationals pick and preview for this MLB matchup at Nationals Park. See who we like to...
Check out our free Diamondbacks vs Giants pick and preview for this MLB matchup at Oracle Park. See who we like to...
Check out our free Red Sox vs Pirates pick and preview for this MLB matchup at PNC Park. See who we like...
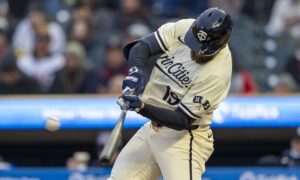
Check out our free Marlins vs Cubs pick and preview for this MLB matchup at Wrigley Field. See who we like to...
Check out our free Brewers vs Cardinals pick and preview for this MLB matchup at Busch Stadium. See who we like to...
Check out our free Tigers vs Twins pick and preview for this MLB matchup at Target Field. See who we like to...
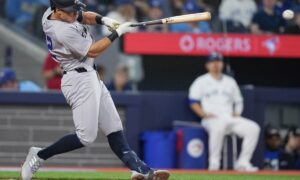
Check out our free Rays vs Yankees pick and preview for this MLB matchup at Yankee Stadium. See who we like to...
In this NBA regular season preview between 76ers and Knicks, see who like to win the game and cover the spread.
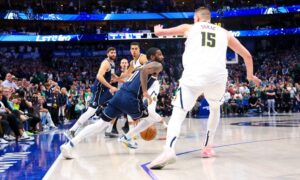
Keep reading to see our Lakers vs Nuggets NBA prediction In this article we will outline who will come away with the...
Check out our Suns vs. Timberwolves prediction to get our insight on to who will win and cover the spread in Minneapolis.
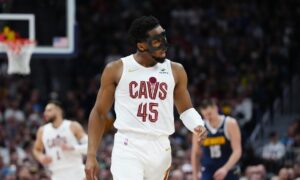
Check out our free Magic vs Cavaliers prediction for this NBA matchup in Cleveland. See who we like to win and cover...